

The Need for Data Skills
Recent decades have witnessed an unprecedented growth in data. Technological developments have led to almost all aspects of our lives leaving digital traces and generating data. It has been estimated that the yearly amount of data created, captured, copied, and consumed globally has increased about 10 times only in the past decade and 70 times since 2010.1
These developments are also changing the educational landscape.2 Whereas in the past most data analysis was done by specialists and researchers, more and more people need to analyse data in their private and professional lives. This in turn makes statistics more applied and requires new pedagogical approaches that make difficult concepts more easily accessible to larger groups with more diverse educational backgrounds.
A Platform to Learn Data Skills
At Summatic we are using technology to make learning statistics and data analysis more interactive, engaging and applied. Our online platform offers comprehensive resources that get students from all educational backgrounds ready to work with data, taking them from the fundamentals of probability all the way up to time series and instrumental variables.
In this blog post we take a closer look
Visualizing Data
To work well with data, you need a good understanding of basic statistical concepts. Our interactive textbooks and graphs pedagogically explain these key concepts. The heuristics and biases literature in economics and psychology has convincingly demonstrated that there is a disconnect between our intuitive understanding of statistics and theoretical concepts, with our intuition relying heavily on available cues and context for inference.3
Interactive graphs and explanations make it possible to give abstract concepts a more natural setting and interpretation by visualizing them, bridging the gap between intuition and theory. Below is an illustration of how this works in practice on Summatic.
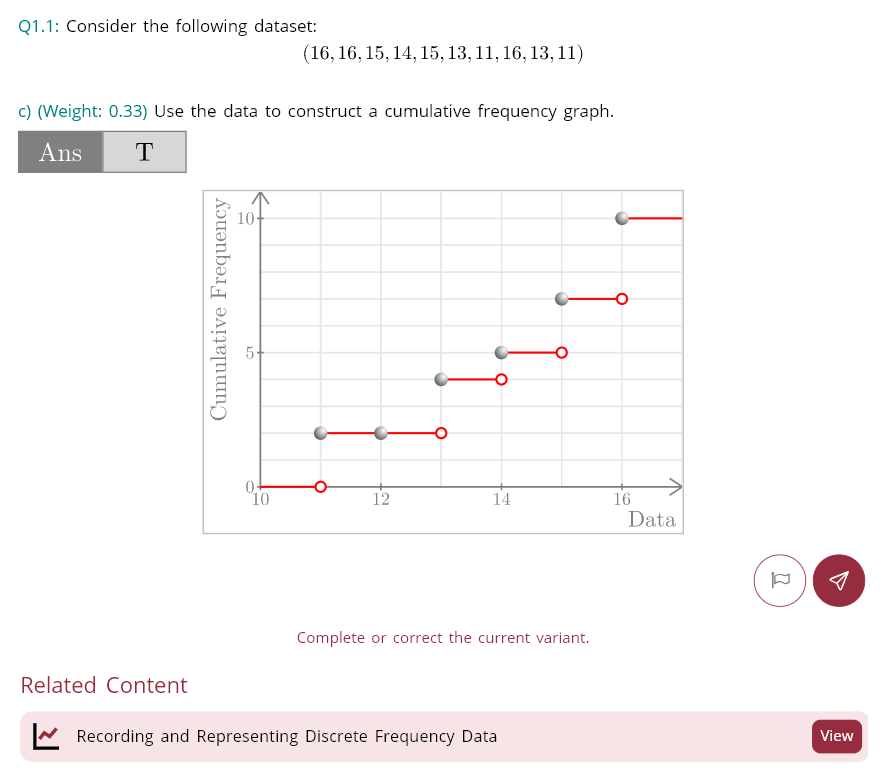
Students are given a randomly drawn dataset and are then asked to fill in a frequency table and to construct graphs using the data, here for the cumulative frequency. They also have access to a linked interactive explanation that help them understand the relationship between data and the cumulative frequency function.
Analysing Data Using Statistical Software
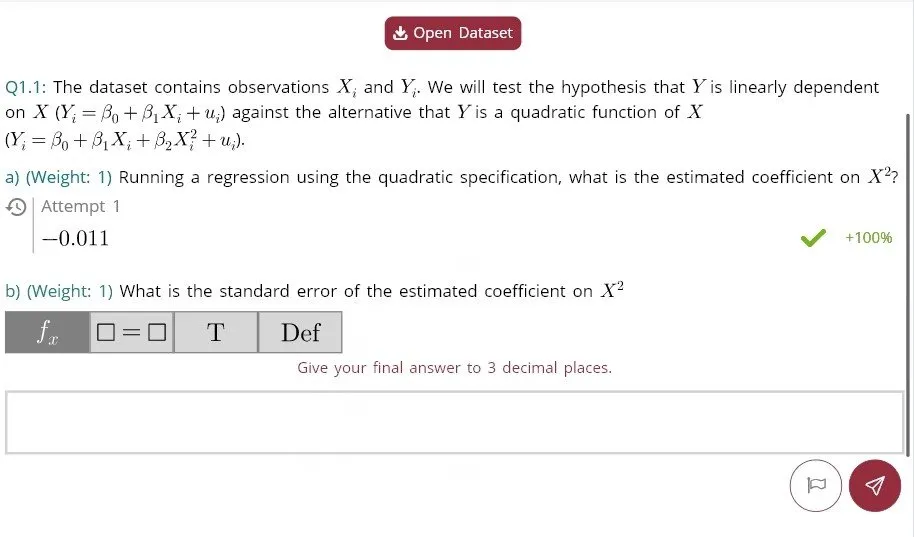
Today most data analysis is done using specialist software like for instance Excel, R and Stata. It is therefore important that students get practice in using these. Our assignments on regression are designed with this in mind. To give students unlimited practice we generate randomized data sets for them to download and analyse externally. Answers can then be uploaded to Summatic where they are automatically marked.
Engagement and Progress
More generally, a key feature of our platform is that it automatically and reliably marks student attempts and answers for a wide variety of inputs, including equations, formulas and graphs. Giving students instant feedback while preserving authenticity and technical rigour in learning and assessment. Summatic also provides random variants of questions, that allow for unlimited practice.
By combining, instant feedback, unlimited practice, hints and interactive explanations, engagement and learning is improved. Students at both Cambridge Judge Business School (CJBS) and the National University of Singapore made more than 250 question attempts each during their courses. And at CJBS, students improved from 33% getting a question completely correct on the 1st attempt to 91% getting it right by the 4th variant.
-
World Economic Forum (2024). Data volume is soaring. Here's how the ICT sector can sustainably handle the surge, Growing data volumes drive need for ICT energy innovation.↩
-
Tishkovskaya, S., & Lancaster, GA. (2012). Statistical Education in the 21st Century: A Review of Challenges, Teaching Innovations and Strategies for Reform. Journal of Statistics Education, 20(2), 1-56. https://doi.org/10.1080/10691898.2012.11889641.↩
-
Gilovich, T., Griffin, D. & Kahneman, D. (Eds.). (2002). Heuristics and Biases: The Psychology of Intuitive Judgement. Cambridge University Press. https://doi.org/10.1017/CBO9780511808098.↩